The Lucky Country

Jason Lindsay
Head of Equities, Octagon Asset Management
First published by NBR on 24 January 2023
ANALYSIS: Australian share market shines globally
With its mild weather, beautiful beaches, bountiful natural resources, and economic performance, Australia is often described as the lucky country (the original intent was not as we know it now – more on that below). On a dreary ‘summer’ day here in New Zealand, it’s hard not to sneak a peek at the Australian Bureau of Meteorology website and marvel at yet another high 20s temperature day in Sydney.
More impressive is the country’s economic record. Donald Horne’s intent in writing his book The Lucky Country was to portray Australia’s climb to power and wealth based almost entirely on luck rather than the strength of its political or economic system, which Horne believed was second rate. In addition to political and economic weaknesses, he also lamented the lack of innovation and ambition, as well as a philistinism in the absence of art, among the Australian population, viewed by Horne as being complacent and indifferent to intellectual matters.
Be that as it may, there is no denying the strength of Australia’s economic credentials.
Australia has the ninth-highest GDP per capita in the world and third-highest among the world’s largest 20 economies. Australia is third in the OECD for household income, with the ninth-highest average earnings in the OECD. Australia has the sixth-largest pool of managed funds and ninth-largest stock market in the world. Most impressively (under most measures), Australia has avoided recession since 1991.
In what was a miserable year for returns globally, the Australian sharemarket performed relatively strongly in 2022, delivering a modest loss of -1.1% (or -5.5% excluding dividends). As set out in the table below, this compares with -14.5% for the S&P/NZX50 and -19.4% for the S&P500. All returns referred to are in local currency and, except for the first two rows, exclude dividends.
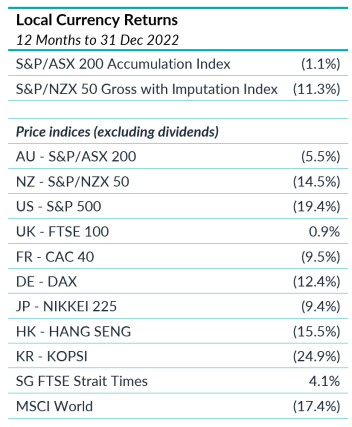
Source: *Eikon / Thomson Reuters
These returns are not solely due to a strong Australian economy, although things are ticking along nicely there, with economic growth at 5.9% per annum, unemployment at 3.4%, and CPI running lower than many OECD countries at 7.3% per annum.
Market composition
Rather, the strong performance of the Australian market has more to do with the composition of the market. As set out in the table below, the Australian market is dominated by Financials and Materials (or Commodities) making up more than 50% of the ASX200. Combined with Energy and Utilities (the only four sectors with positive performance in the Australian market in 2022) these sectors make up 61% of the ASX200. This compares with 25% in the NZX50 (heavily skewed by the electricity gentailers) and 23% in the S&P500.
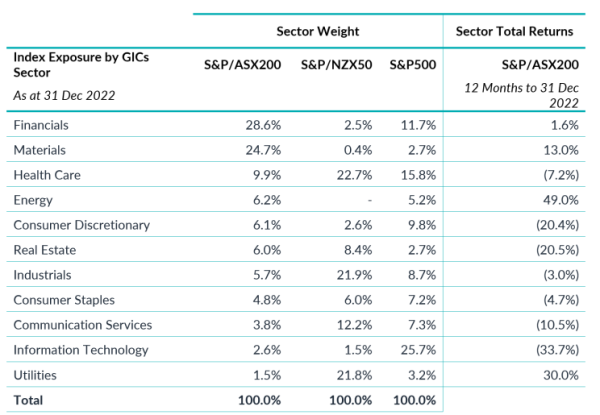
Source: *Eikon / Thomson Reuters
Sharply rising interest rates are bad for equity markets. It is particularly negative for growth stocks (especially Information Technology) with longer dated earnings, while Consumer Discretionary and defensive yield stocks without pricing power also tend to underperform the market.
Value stocks, including Industrial stocks trading on cheaper multiples, Materials (Commodity), Energy, and Financial stocks tend to outperform the market. The latter in particular when the yield curve is steepening, meaning longer-term interest rates are increasing faster than shorter-term interest rates.
Since the end of 2021, the benchmark Australian 10-Year Government Bond Rate, a key input to equity analyst valuations, has more than doubled from 1.7% to 4.05% (at December 31, 2022).
Best performers
Energy was the best performing sector last year with a total return of 49%. The Energy sector is often a strong performer in periods of high inflation and 2022 proved no different. Coal stocks were the strongest performer within this group. Woodside was also a standout performer after acquiring BHP’s old petroleum assets.
Utilities was the second-best performer with a gain of 30% supported by the rise in electricity prices that occurred as the cost of coal and gas increased along with corporate activity in this narrow sector of only three companies.
Stocks that benefited from higher interest rates also outperformed. This was a key driver of the outperformance of insurance and banks plus individual stocks such as Computershare and Challenger.
Technology was the worst sector with a fall of 34%. Just as Technology benefited the most from PE (price to earnings) expansion as real yields fell, the sector saw the largest valuation headwinds as real yields rose in 2022.
Continued strength in activity and labour market data suggest the Australian economy will remain resilient in the near term. This strength may fade over the coming year as a combination of lower credit demand and weaker global growth affect the outlook for commodities and consumption spending.
This has negative implications for corporate earnings, which appear likely to contract in 2023. We continue to see labour costs as a key risk in 2023 with wage momentum picking up in the last few months of the year.
Strong wage growth could pressure the RBA to move rates higher, increasing the odds of an economic hard landing and an end to the market leadership of 2022.
Can the lucky country stay lucky for a little longer?
This article has been prepared in good faith based on information obtained from sources believed to be reliable and accurate. It does not contain financial advice. This article was supplied free to NBR and first published 24 January 2023.
This is not a recommendation to buy or sell any financial product and does not take your personal circumstances into account. All opinions reflect Octagon Asset Management judgement on the date of communication and may change without notice. Past performance is not a reliable guide to future performance.
We recommend you take financial advice before making investment decisions. We have prepared this web page in good faith based on information obtained from other sources, but we do not guarantee the accuracy of that information. We do not make any representation or warranty (express or implied) that this web page is accurate, complete, or current and to the maximum extent permitted by law disclaim any liability for loss which may be incurred by any person relying on this web page.