Searching for an edge through dividends

Christine Smith-Han
Equity and Strategy Analyst, Octagon Asset Management
First published by NBR on 20 September 2022
ANALYSIS: Companies should be aware of the signals they send with dividend notices.
One of the simplest truisms in investing is that share prices follow profits – on average, over the long term. Perhaps we can help pick some of these profit growers through time by looking at another metric – dividends. In active funds management, we are always searching for an edge. Quantitative tools can help inform us by dispassionately looking at risk and return relationships through time.
The dividend growers…
Why might screening on this metric work?
- Dividends can only be paid out of cash – if profits are not backed by cash, eventually the dividend will have to be cut.
- Dividends ultimately have to be paid out of profits – you can borrow to pay dividends for a while as you invest, but eventually gearing constraints will force you back to paying out of profits.
- Dividends can be a powerful capital management signal – how much of our profit do we need to retain to grow into the future, and have we spent that money wisely in the past? Have retained profits generated greater profits and growing dividends?
- Dividends can be a signal of operating stability – cutting dividends might imply an uncertain outlook or may signal a push for growth investment, which comes with uncertain paybacks.
- Once companies have initiated paying dividends, it sends a signal to investors about the quality of the business.
A study by Aswarth Damadoran, examining the cumulative average return on days relative to the ‘Announcement Date of Dividends’ on US and Canadian stocks, shows that share prices react much worse when dividends are cut than when they are raised by the same amount.
Predictability and quality of profits matter to investors and dividends can be an important signal.
Paying for projects
Most companies have projects they want to fund for development and they retain profits for this reinvestment. Where these companies have strong prospects and incremental returns are high, they might pay no dividend at all. This quantitative tool will not help identify those companies.
There is a relationship with growth, however. When we track earnings growth rates through time, Damadoran’s studies examining the relationship between dividend initiation and annual earnings growth rate show the earnings growth rate trends up right through to the year of first paying a dividend. Post the first dividend pay-out year, the earnings growth rate slows down. This relationship has a strong theoretical basis, given rates of profit retention and return on equity together drive the growth rate in corporate profits.
So, on the one hand, paying out dividends shows capital discipline and operating stability by returning cash to investors where clearly accretive growth investments have not been identified. On the other hand, it could signal a change in the business' growth phase, cycling into a maturing industry.
Not a straightforward signal.
Strong overlap
A portfolio strategy that focuses on companies that are growing their dividends consistently faster than the average company over a long period of time could outperform the market. To do this as a company, you need to be steadily growing earnings, and your earnings can’t be too cyclical. There is a strong overlap with growth and quality metrics when you interpret the dividend signal this way.
It is not easy to meet the hurdle of consistently growing dividends. You cut your dividend once, you’re out. Your pay-out ratio gets too high or starts being funded by debt, you’re out. You make a bad investment and have to raise a lot of equity or cut the dividend, you’re out. You hold your dividend flat whilst the average company dividend grows, you’re out.
Those firms who manage to clear these challenging dividend consistency and sustainable pay-out hurdles can also protect our investment from dilutive equity raises over time.
It is not dividend yield that drives this tool, it is dividend growth, as measured in cents per share. A high dividend yield has a strong correlation with value (versus growth) and changes in dividend are often a powerful signal when reviewing companies in that space also, but for different reasons.
With the dividend growers hurdle a high bar to jump, small markets such as the New Zealand equity market can deliver very concentrated results. Maybe only two or three companies can clear the hurdle and that would lead you into a very risky portfolio – in fact, you are taking single stock risk at that point and losing all the benefits of diversification.
Even in Australia, the number of stocks that clear the hurdle is not huge; in any given year, it ranges between about nine and 12 stocks. It still carries a large concentration risk, with a high tracking error and a return for risk lower than most would find acceptable.
The chart below shows handsome outperformance, but it has been achieved in a very risky way, and you can see that in the drawdown that has occurred in 2022.
Valuation
The screen says nothing about valuation – there is no price-to-earnings ratio or discounted cashflow analysis. Just a consistent history of dividends per share growth. When an investment strategy becomes very popular, valuations tend to grow beyond the pace of dividend (or earnings) growth.
This screen has an on/off switch, not a thermometer. You are in until you are out.
Valuation screens, on the other hand, tend to give you a warning signal before a correction occurs.
There are some in finance that say dividends are irrelevant. In the typical discounted cashflow analysis (dividend discount model aside) that is true; the valuation of the firm depends on its free cashflows, not its dividends. The firm will retain enough profits to take advantage of strong projects and return the rest. Dividends are an outcome of that, not a driver.
However, there is the human behavioural and signalling impact to be considered, and nothing in finance and valuation ever comes down to a single metric. The chart below suggests this is one metric you might want to keep a close eye on.
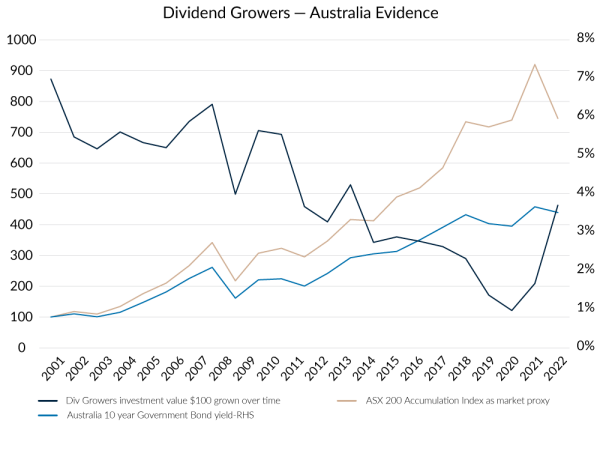
Source: Forsyth Barr analysis, Bloomberg and Octagon Asset Management.
This article has been prepared in good faith based on information obtained from sources believed to be reliable and accurate. It does not contain financial advice. This article was supplied free to NBR and first published 20 September 2022.
This is not a recommendation to buy or sell any financial product and does not take your personal circumstances into account. All opinions reflect Octagon Asset Management judgement on the date of communication and may change without notice. Past performance is not a reliable guide to future performance.
We recommend you take financial advice before making investment decisions. We have prepared this web page in good faith based on information obtained from other sources, but we do not guarantee the accuracy of that information. We do not make any representation or warranty (express or implied) that this web page is accurate, complete, or current and to the maximum extent permitted by law disclaim any liability for loss which may be incurred by any person relying on this web page.