Banking on Profits

Tobias Newton
Equity Analyst, Octagon Asset Management
First published by NBR on 13 June 2023
ANALYSIS: The fact NZ banks aren't taking on more risk than those in other countries, but generate far higher returns, is intriguing.
How profitable are New Zealand’s banks? Seems a fair question after 525 basis points of rate hikes in 20 months and the highest Official Cash Rate (OCR) in nearly 15 years.
Well, in the year to 31 March 2023 banks made close to $10bn in pre-tax profits, up +8.7% from the prior year. That equates to nearly ~$2,000 in pre-tax profits for every person living in the country at that time. It’s big money whichever way you look at it.
Most of this profit pool is captured by the ‘big four’ Australian owned banks, namely ANZ, ASB, BNZ and Westpac. Together, these four banks generate in excess of 90% of all pre-tax profits in the New Zealand banking system, with Kiwibank a distant 5th (about ~2.5%) and a long tail of much smaller players. Given their dominance, this article will focus on the four major banks (the ‘majors’).
So what drives bank profits? Naturally the vast majority of income in the NZ banking system comes from net interest margin (NIM) which is typically >80% of banking income. This is essentially the return on interest earning assets (mostly loans to customers plus the interest on debt securities the bank may hold), less the cost of funds, or cash paid on interest bearing liabilities (mostly customer deposits and any debt securities issued). The rest of the majors’ income is fees and commissions (~13.7% on average for the previous five years including funds management, account and credit card fees and other non-lending services) and any gains arising from their trading and hedging activities (~4.3% on average for the previous five years, and this is slightly higher for ANZ and BNZ).
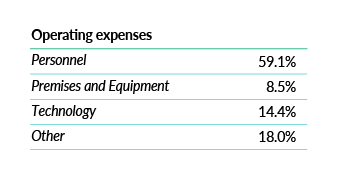
On the cost side of things, staffing is by far the largest expense, accounting for just under 60% of total operating expenses for major banks. Other significant expense categories include technology spend and premises. The table below provides a high-level summary.
Average across major banks (last reported, NZ)
With that as background, how does the profitability of major bank NZ divisions stack up versus the group overall? When analysing bank profitability, the focus is on returns on equity (ROE), this helps us understand how efficiently a firm uses shareholder funds to generate returns. For highly levered banking institutions, ROE is more meaningful than Return on Invested Capital (ROIC) or other asset-based measures of return. The chart below compares the average returns on equity of the majors to their Australian parent companies (which include the NZ contribution). The data shows that NZ operations produced higher returns than the average of their Australian parent entities, certainly for the last five years. Prior to this, and notably before the Australian Royal Commission Inquiry into banking that was launched in 2017 and the release of the Hayne report in 2019, the difference was less meaningful.
Major Bank Profitability NZ Division vs Group
Financial Year, Average ROE
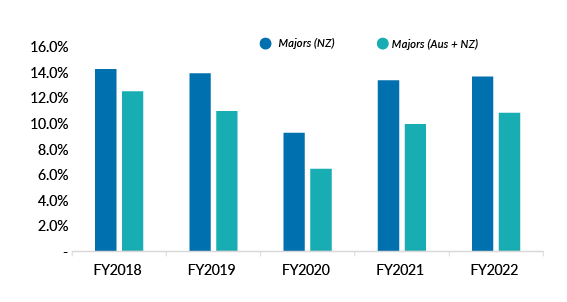
Source: Thomson Reuters, RBNZ data
To explain the high returns achieved in New Zealand, we need to look no further than net interest margin. The charts below compare the net interest margin of all banks in New Zealand of which the majors make up ~87% of the market (top) to a similar chart (bottom) showing the net interest margin of the major banks in Australia.
NZ Banks' Net Interest Margin*
Domestic, Quarterly
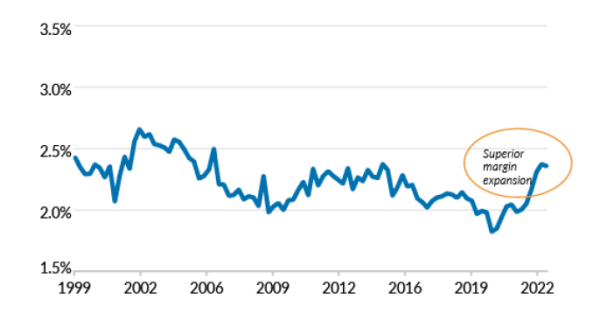
Source: RBA research, RBNZ FSR data
Major Banks' Net Interest Margin*
Domestic, half-yearly
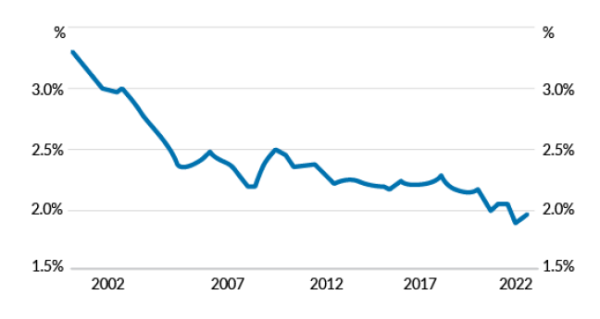
- Data for a given period relate to banks' public profit reports released in that half; IFRS basis from 2006, AGAAP prior; excludes St George Bank and Bankwest prior to the first half of 2009.
Sources: Banks' financial reports; RBA
Source: RBA research, RBNZ FSR data
From the charts above we can conclude:
• NIM in Australia was generally higher than New Zealand prior to the GFC;
• NIM in Australian banking has been in structural decline for the last two decades; and
• NZ banks’ NIM has been relatively steady through the period, with material margin expansion in the last three years, versus a decline in Australia.
Despite similar themes around deposit gathering, economic growth and strong credit performance, the two markets have diverging bank margins. The banks’ average lending exposure in NZ is also very similar to Australia, comprised of ~65% housing (mortgages), 30 to 35% business and agriculture lending, with the residual lending being consumer credit and everything else. One fundamental difference between the Australian and NZ mortgage markets is the structure of lending. It’s been largely fixed rate in NZ (close to 90% of the market) versus mostly variable rates (typically 85%+) in Australia, with the mix relatively stable over the longer term. Whilst this structural difference has been consistent over the long term, the margin difference has not, suggesting other factors may be at play.
As pandemic related monetary and fiscal stimulus flowed through the financial system in both NZ and Australia, banks saw a large benefit on the funding side. This came via increases in customer cash balances, mostly across transaction accounts and on-call savings. This is helpful for bank profitability because on-call customer deposits are generally the cheapest source of funding for a bank (they pay the lowest interest rate to customers). With more of this cheap on-call funding available, there was less need to borrow in significantly more expensive wholesale debt markets. The major banks have done a good job in controlling the cost of these customer deposits (red and blue lines on the right-hand chart), which have barely increased relative to the RBNZ’s cash rate, or their own lending rates for mortgage and business customers (left-hand chart). In NZ, transaction and savings balances (as opposed to term deposits) currently account for 55% of total deposit funding, versus ~45% in 2019.
NZ Bank Lending Rates
Average, Annualised %
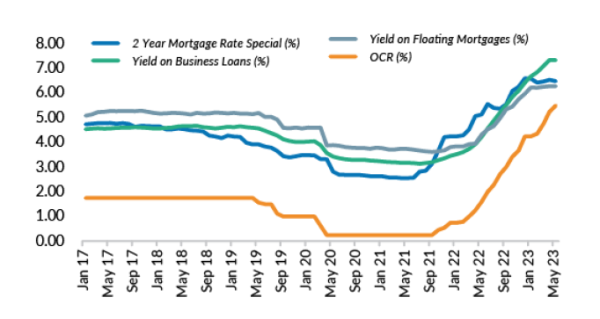
Source: RBNZ Data, Octagon Analysis
NZ Bank Deposit Rates vs OCR
Average, Annualised %
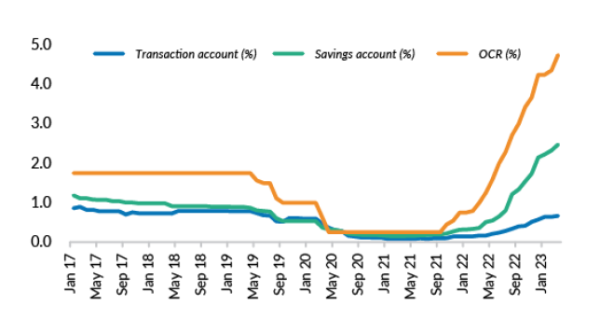
Source: RBNZ Data, Octagon Analysis
Those complaining about savings accounts and term deposit rates not rising as fast as borrowing rates may have good reason for doing so. Combine this strength in net interest margins with a period of strong credit performance (i.e. lower than expected credit losses) and the stage is set for the profit upswing that we’ve seen in recent years. As an aside, we’d suggest looking at the many cash plus or enhanced cash investment funds now offering higher interest rates (after fees) than those savings and term-deposits available at the banks, after all, signing up is easy these days – beat the inertia!
Risk and Return?
In their Financial Stability Review the RBNZ produced another useful piece of research to consider when thinking about bank profitability. This research looks at the relationship between long-term returns and earnings volatility (a proxy for risk) for banks in a range of countries between 2000 and 2021. I’ve recreated the chart below.
Analysis of Pre Tax Returns on Equity (ROE)
Selected Countries, period 2000-2001
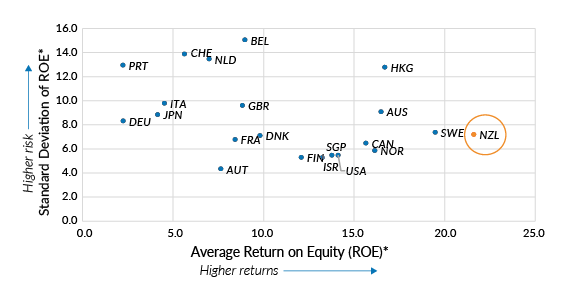
Source: RBNZ Financial Stability Review
The outcome was quite remarkable. Of 21 countries, including all of our closest peers, our banks have the highest long-term returns on equity of all those measured (shown on the x-axis). Not only do banks in NZ produce the highest returns, but they do this while taking a below average level of risk, as measured by the standard deviation of returns (y-axis). The fact NZ banks aren’t taking on more risk than those in other countries, but generate far higher returns, is intriguing.
Unless the majors are all exceptionally efficient (unlikely given they aren’t earning these excess returns in Australia) the data suggests that there are other forces at play. This is worthy of deeper analysis and beyond the scope of this article, but we observe a highly concentrated market and a lack of meaningful competition as defining features. A commercially run entity should always look to maximise returns, but the question must be asked, have banking regulators done enough to enable real competition in this market? Acknowledging that an optimal balance of regulation, that supports competition but also maintains financial system integrity, is not a straightforward proposition. But just saying that finding the balance is all too hard is an easy out. After all, that is the mandate of a regulator.
This article has been prepared in good faith based on information obtained from sources believed to be reliable and accurate. This article was supplied to NBR and first published 13 June 2023.
This is not a recommendation to buy or sell any financial product and does not take your personal circumstances into account. All opinions reflect Octagon Asset Management judgement on the date of communication and may change without notice. Past performance is not a reliable guide to future performance.
We recommend you take financial advice before making investment decisions. We have prepared this web page in good faith based on information obtained from other sources, but we do not guarantee the accuracy of that information. We do not make any representation or warranty (express or implied) that this web page is accurate, complete, or current and to the maximum extent permitted by law disclaim any liability for loss which may be incurred by any person relying on this web page.