Understanding basic ratios
There are many terms you hear in relation to investment markets.
If you’re new to investing, understanding some of the basic ratios can help.
Below we introduce four common ratios and provides a simple explanation of what they mean.
Earnings per Share (EPS)
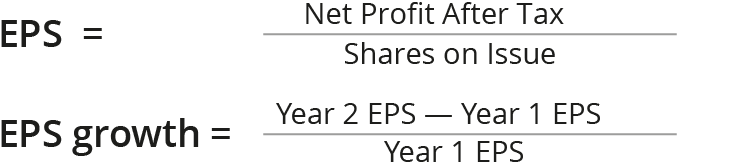
EPS is the proportion of a company’s after tax earnings attributed to each share on issue. As well as looking at the absolute level of EPS, the strength and stability of a company’s earnings may be ascertained by also measuring EPS growth and reviewing the predictability or volatility of earnings over time. The information for calculating a company’s EPS comes from its Statement of Financial Performance (Profit & Loss Statement).
EPS and EPS Growth are calculated as:
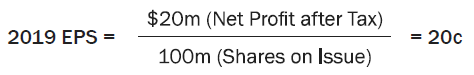
Example
Calculate the 2019 EPS for Company A, using the information below.
| Statement of Financial Performance | 2019 | 2018 |
|---|---|---|
| Revenue | $100m | $90m |
| Operating Expenses | ($60m) | ($55m) |
| Earnings before Interest, Taxation and Depreciation | $40m | $35m |
| Depreciation | ($5m) | ($5m) |
| Earnings before Interest and Taxation (EBIT) | $35m | $30m |
| Net Interest | ($5m) | ($5m) |
| Surplus before Taxation | $30m | $25m |
| Taxation Expense | ($10m) | ($10m) |
| Surplus after Taxation | $20m | $15m |
| Shares on Issue | $100.0m | $100.0m |
Answer
Example
Calculate the 2019 EPS growth for Company A, using the same information.
Answer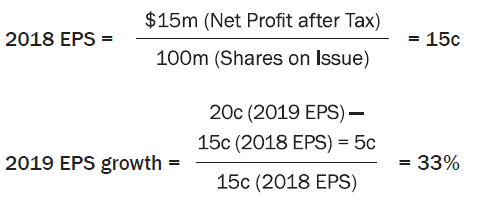
Basic PE Ratio
The price to earnings ratio (PE) is a widely used value indicator. A PE is a rough proxy for the time required in years for an investor to recover the purchase price from a company’s future earnings. A PE is a universal indicator, which presents earnings and share prices in a common ratio, enabling comparisons to be made between companies, irrespective of the currency and country in which they trade and report profits (i.e. P/E’s enable a comparison to be made between a New Zealand company and an Australian or a US company). Most commonly, a PE comparison is undertaken to compare a company with its industry peers or against an overall market.
PEs generally lie in a range between 8x and 30x. A low PE suggests either the company is cheap or the company has a low earnings growth outlook (hence it would take many years of earnings to repay the purchase price). Conversely a high PE could indicate an expensive stock or a high earnings growth company (the accelerating earnings would repay the purchase price more quickly)
The formula for calculating a P/E ratio is:
![]()
Example
Using the 2019 EPS derived from in the previous question, and assuming a current market price of $2.50, calculate Company A’s 2019 PE ratio.
Answer![]()
Example
Kiwi Construction, a New Zealand based building company, reported a 2019 EPS of 50c and trades at a current share price of $5.00. Wallaby Building, an Australian based building company, reported a 2019 EPS of A60c and trades at a current share price of A$6.60. Which trades on a higher PE ratio?

Answer
Wallaby’s P/E of 11.0x is higher than Kiwi’s P/E of 10.0x.
Dividends
A dividend is a payment or distribution made to share holders from a company’s profits. Most commonly, dividends are paid twice a year (although sometimes they are paid annually or quarterly). The first payment is referred to as an interim dividend and corresponds with a company’s interim profit result. The second dividend is the final dividend and is paid soon after a full year result is released. The interim and final dividends are sometimes the same amount but may be of differing amounts.
Payout Ratio
Some companies aim to provide smooth (and gradually increasing) dividend payments over time, while others have a dividend policy which stipulates a certain percentage of profits in each year to be distributed to shareholders. The payout ratio for a company is the percentage of profits distributed each year in dividends.
The formula for calculating a payout ratio is:
![]()
Companies that are growing rapidly and require funds for expansion tend to retain a large proportion of their profits and have a low payout ratio. In contrast, companies in a mature industry with often predictable earnings streams and little need for expansion capital tend to have a high payout ratio.
Example
Calculate the payout ratio for Company B if DPS is 15c and EPS is 20c.
Answer![]()
Dividend Yield
The dividend yield is the expected income return over the next year on a share investment at a given purchase price.
The formula for calculating a dividend yield is:
![]()
Example
Calculate the dividend yield for Company C if DPS is 15c and current share price is $3.00.
Answer![]()
If you are interested in other investor education insights from Martin visit the Investor Education page.
Martin Hawes is an Authorised Financial Adviser. This is not a recommendation to buy or sell any financial product and does not take your personal circumstances into account. All opinions reflect our judgement on the date of communication and may change without notice. Past performance is not a reliable guide to future performance. We recommend you take financial advice before making investment decisions. We have prepared this web page in good faith based on information obtained from other sources, but we do not guarantee the accuracy of that information. We do not make any representation or warranty (express or implied) that this web page is accurate, complete, or current and to the maximum extent permitted by law disclaim any liability for loss which may be incurred by any person relying on this web page.